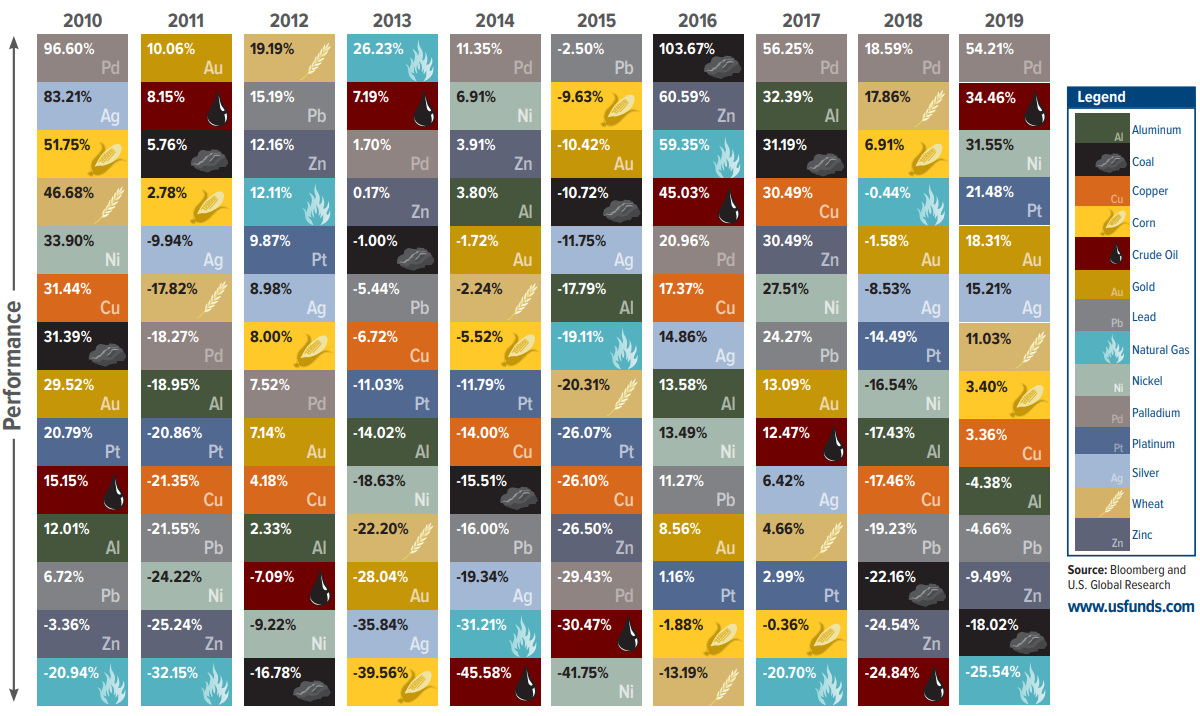
Back in the days when alchemists roamed the earth, their ultimate challenge was transforming lead into gold. Looking at the chart below, that would have been the equivalent of filing down the corners of a fifty pence piece to make ten pence pieces. Lead has been a far more valuable investment than gold on many occasions.
This chart plots the history of commodity returns, seen by many as a more specialist, speculative market. We don’t hold any commodity funds in our portfolios. Our evidence-based approach is backed by academic research and while we hold companies that trade in, produce, or transport commodities, we don’t invest directly into commodities themselves.
What is interesting is the level of confidence commodity analyst comments contain. It feels remarkably like the kind of stock market media chatter we hear. Credible, detailed reasoning why certain shares or sector will perform better than others with more financial models than you can wave a wand at projecting attractive market leading returns.
As is the case with stock market returns, commodity performance looks very random. In finance, ‘Random Walk theory’ suggests that changes in stock prices have the same distribution or spread of results and are independent of each other. Therefore, it assumes the past movement or trend of a stock price or market cannot be used to predict its future movement. Commodities appear no different.
Commodities have no dividend or income stream. They are speculative best guesses where investors hope they have read the tea leaves correctly. As the chart shows, the previous winners rarely show up again. Except lead, which appears to have successfully performed its own alchemy. Rather than plumbing the depths each year, it occasionally floated to the top. Is this any guide to future performance? Unlikely.